Chapter 3: Performance Metrics
There is an old adage in management:
“You cannot manage what you cannot measure.”
Any time we wish to improve the performance of a process or system, it is important that we have a clearly defined performance metric, recognizing that there are often multiple metrics. Before we start down the road of discussing the complex issues associated with metrics, we have to first acknowledge that there is no shortage of problems that do not have well-defined metrics, such as who to marry, what job to take when graduating from college, or choosing what to paint or which sculpture to purchase. If you have trouble identifying at least one clearly quantifiable metric, it is likely that your problem belongs in the complex domain of human decision problems which are not going to benefit from analytical thinking.
But if you can identify at least one clear, quantifiable metric, keep reading.
Categories of metrics
There is a vast range of metrics, so it helps to try identifying major categories of metrics. Some of the more popular categories are:
- Financial metrics - These include any metric measured in a currency. They might be measured:
- Total quantity - Cash on hand, loan guarantees, investments.
- Per unit time (day, month, quarter, year), typically representing cost, revenue or profit.
- Per unit of a resource - Dollars per person, machine, facility, or per share.
- Productivity metrics - These are non-dollar denominated metrics that may also be measured per unit time (patients seen, units produced, miles traveled) and per unit of a resource (per person, per machine, per facility).
- Effectiveness metrics - Strength of a material, performance of a drug, yield from a manufacturing process, mean time between failures of a machine.
- Service performance - How well we are serving markets or external agents, such as demand covered, performance ratings by customers, placement of students.
- External performance ratings - The ranking of a school, reliability of products made by a company, sales ranking, rating of hospitals.
- Behavior metrics - Deviation between actual decisions from predetermined directions or guidelines.
- Estimation metrics - How well do we estimate or predict quantities (future demand, rainfall, amount in inventory) or parameters (patient diagnostics, cost of production). These assume we have some way of comparing a prior estimate to an observation of actual performance.
There are two ways to evaluate each category of metric:
- Average performance - These are totals or averages over time, capturing what would actually be experienced.
- Risk metrics - These measure events that are not properly represented by an average.
Average performance and risk metrics are discussed further in the section below.
It helps to provide specific examples. Below is a list of metrics from different categories.
- Financial metrics
- Profitability metrics
- Net income.
- Gross profit margin.
- Operating profit margin.
- Return on assets.
- Return on equity.
- EBITDA – earnings before interest, taxes, depreciation and amortization.
- Liquidity metrics
- Current ratio (current assets/current liabilities).
- Quick ratio (current assets-inventory/current liabilities).
- Efficiency metrics
- Asset turnover ratio (revenue/total assets).
- Inventory turnover (cost of goods sold/average inventory).
- Solvency metrics
- Debt to equity ratio (total liabilities/shareholders equity).
- Interest coverage ratio (EBIT/interest expense).
- Valuation metrics
- Earnings per share (EPS) – net income/average outstanding shares.
- Price-to-earnings ratio (P/E) – Market price per share/earnings per share.
- Profitability metrics
- Productivity metrics
- Fraction of time the asset is being used.
- Number of jobs/tasks completed per week.
- Number of jobs/tasks completed on time or late.
- Mean time between failures (MTBF).
- Mean time to repair.
- Effectiveness metrics
- Machines come in a vast array of styles, from cars to air conditioners to blenders. In all cases, there is an assessment of whether it “works,” although complex machinery such as a car can fail in a variety of ways, from not starting to a blown tire to the defroster not working. A car may work, but the gas mileage may be lower than expected.
- A plastic may be required to be heated to a given temperature without melting.
- A laptop may need to perform at a certain speed.
- Performance of a medication (e.g. for weight reduction).
- Strength of a material.
- External performance ratings
- Product sales (unit sales or revenue), rate of growth.
- Cost of customer acquisition.
- Number of positive reviews.
- Rate of product returns.
- Rate of customer churn (customers declining to renew the contract).
- Labor performance
- Number of pieces attached/inspected per hour (manufacturing).
- Monthly sales within someone’s region or product line (sales).
- Whether a project is finished on time and on budget (management).
- Number of calls handled/customer rating (call centers).
- Employee retention/turnover.
- Rate of positive employee assessments in annual HR surveys.
- Salary required to attract and retain people.
The metric pyramids
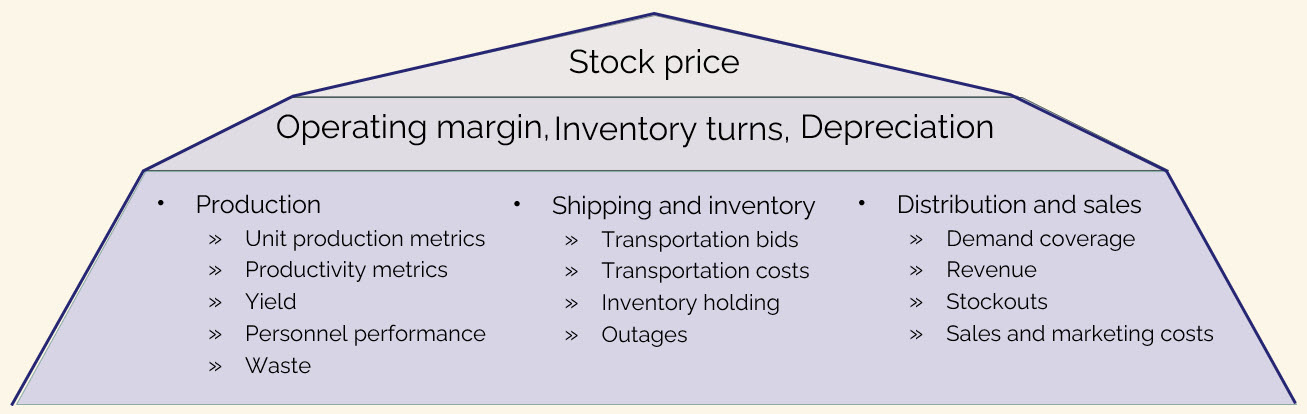
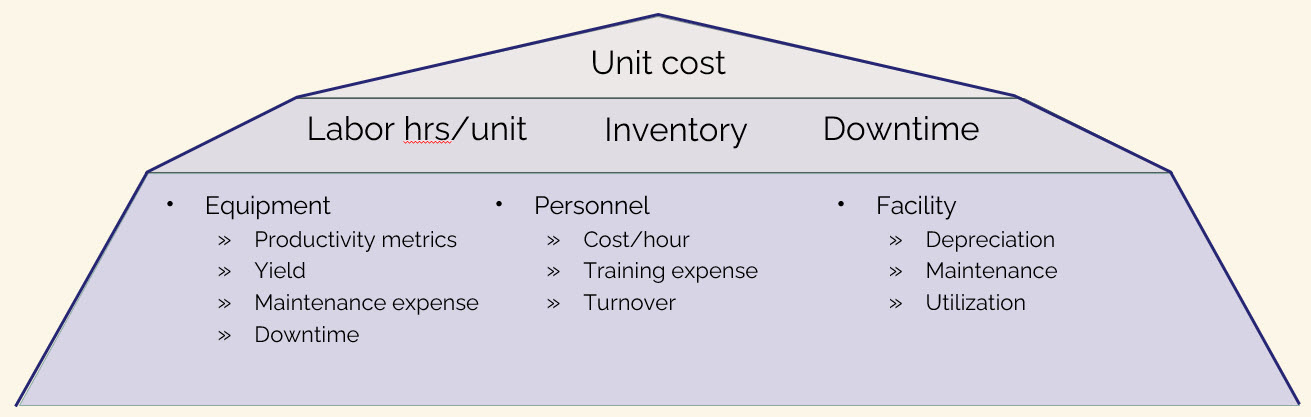
It is common, especially in business, to compile lists of metrics, where these lists can be quite long. It is very important to prioritize the metrics, which can be done fairly easily by organizing them into pyramids, as shown in figure 3.1. Figure 3.1(a) illustrates a potential set of metrics for someone working at the highest levels of a company (often called the “C-suite”) where the most important goal is to maximize the quarterly stock price. These metrics, however, do not provide much guidance for someone working in a manufacturing plant where the most important metric might be cost, followed closely by production and quality. Figure 3.1(b) illustrates how a different pyramid can be created for someone who might work in manufacturing, where there is more emphasis on cost.
The organization of metrics into a pyramid is largely subjective, but there should be a single metric at the top which is felt to be the most important metric. The top metric should be one that is either maximized or minimized, but the same is not necessarily true of all of the other metrics, an issue we address next.
Objectives, targets and limits
We next need to specify what we are trying to achieve with each metric. There are three ways we can approach using metrics to evaluate performance:
- Maximize/minimize – We often want to maximize or minimize a metric where bigger (or smaller) is always better. We may want the strongest material, or highest energy density, or the lowest cost.
- Targets – Here we are trying to hit a particular value, which might be a patient’s body temperature, or the voltage in an electrical transmission line. Companies might want to hit projected targets for revenue or profitability to help control volatility.
- Upper/lower limit – A pre-diabetic patient may wish to keep their A1c level (a measure of blood sugar) below 6.0. A furniture retailer may wish to sell their current inventory (but no more). A truckload carrier would like to let each driver move 2000 miles per week, but no more, since the carrier would never be able to sustain a larger number, and the driver can be disappointed when high-mileage weeks are not repeated.
While there can be different ways to measure performance, ultimately a computer has to be able to look at a set of decisions and choose which one is best.
Handling multiple objectives
Often there are multiple objectives to be maximized or minimized. While there is an extensive literature on multi-objective optimization, ultimately it will become necessary to combine these metrics into a single utility function that requires assigning weights to each metric. The metric at the top of the pyramid (which tends to be one that needs to be maximized or minimized) typically serves as the base, while other metrics are weighted relative to the top metric.
When multiple metrics have to be combined into a single utility function, it raises the issue of how to weight them. We recommend that the weight on the metric at the top of the pyramid be set equal to 1.0, which means that the weights of other metrics (which are not necessarily in the same units) have to be scaled relative to the top metric. Initially these weights can be set subjectively, but eventually this will lead to a set of decisions that produce a level of performance in each of the dimensions that is being maximized or minimized. If a domain expert is not happy with the performance in some dimension, the usual path is to adjust the weight and then reassess after seeing a new set of decisions.
Average performance vs. risk
If we run 20 simulations to evaluate some process for making decisions, we are evaluating our method based on average performance. We can do this if we have access to a simulator, but an alternative is just to watch how it works in the field for a period of time. In this case, we are following a single sample of observations and using the actual performance to evaluate our method. We could say that watching the actual performance is like taking an average of just one observation.
The actual performance in the field is what we experience. For companies, this is captured in their profit and loss statements, as well as any other reports summarizing their other performance metrics such as the various financial KPIs, along with statistics on inventories, and the utilization of facilities and equipment. In a health setting we might be looking at the average rate of new infections or deaths from overdoses. A hotel will look at room utilization and revenue. Truckload fleets will collect statistics on revenue per driver and empty miles.
Now, consider the problem of a sudden disruption in the normal operations of the company. It could be an earthquake or tsunami that destroys a major manufacturing plant, or the emergence of a disease such as COVID disrupting consumption patterns. A tariff war could break out, severely disrupting global trade.
We have already recognized the presence of different sources of uncertainty, as we did throughout Chapter 2, so why are we drawing attention to these new sources of uncertainty? Isn’t it the case that if one of these major events happens, that its effect will be captured as we accumulate our performance metrics over time?
The simple answer is: no. Imagine that there is a major disruption in a supply chain so that we have to go through a period of time where we cannot serve our market. Most important is that we may lose customers to competitors as they may not be willing to wait until the problem is fixed. In addition, we may have to furlough significant numbers of employees because we do not have the parts needed to run the factories. This is a hardship for the employees, leading to dissatisfaction, and the best employees may find better jobs.
These issues are not captured by the usual accounting processes that track corporate performance. It is this reason that there is an array of books addressing what is widely referred to as “risk” (or “resilience” which refers to the ability of companies to bounce back from major events) as shown in figure 3.2. These books are typically qualitative descriptions of different types of risk, often (but not always) without a formal process for handling risk.

Risk is a term that is generally used whenever decisions have to be made in the presence of uncertainty. Some examples of risk that might arise in the context of applications in Chapter 2 might be:
- Bud Light once introduced a marketing campaign aimed at the LGBTQ community. Their sales dropped by 25 percent as many of their conservative customers reacted badly, which represented a severe disruption to their entire production process.
- The scheduling of power generators considers the potential that a generator (such as a nuclear power plant) might fail, but they would not be able to handle two failures of this magnitude, which would result in rolling blackouts.
- An incorrect diagnosis for a patient might result in the patient’s death.
- A failure to provide sufficient cash reserves for a manufacturer could result in bankruptcy given a major drop in the economy, as happened in 2008 with the auto industry.
These events are simply not properly accounted for by accumulating the usual performance statistics. For this reason, it is necessary to account for these events, which may have very low probability, separately from average or actual performance.
The management of the power grid provides a nice illustration. The companies that manage their grids are required to schedule enough power to handle the event that their largest generator (which would be a nuclear power plant) fails, which would produce blackouts. There is no attempt to quantify the economic impact of a blackout. Instead, they simply put it in a separate category, and require that they can handle a major outage.
The literature on risk can be roughly divided into two categories:
- General domain-specific discussions, such as the books in figure 3.2 for supply chain applications, which typically provide lists of events that people in the field would agree constitute “risk.”
- The mathematical research literature, largely focused on finance, which uses well-defined risk metrics such as the probability that the financial return falls below some target (typically represented as “VaR” or “CVaR”), or simply the standard deviation of a performance metric (such as the financial return).
The first group, which consists of the types of books shown in figure 3.2, use plain English to describe events that most would generally agree represent examples of risk that should be avoided. The second group consists of books and papers that are often highly theoretical, but which limit their characterizations of risk to extreme values of well-defined probability distributions.
Surprisingly, neither literature provides what could be described as a formal definition of risk that applies broadly to the wide range of settings in which risk seems to be an issue. We offer such a definition here, but we begin by providing a formal name for our original objective, which is based on a simulation of our process, either in a simulator or in the field:
The base objective – This is how we would evaluate our decision-making process over time in the field through the normal accumulation of performance metrics (including, but not limited to, profit and loss statements). For companies this is typically (but not always) in monetary units, but it could be deaths in a public health setting, loaded miles per driver for a trucking company, and votes in a presidential election.
Now we are ready to define risk:
Risk – Risk consists of two dimensions:
- Risk events – These are events which in the subjective judgment of domain experts (managers, physicians, politicians) are not properly captured by the base objective. Risk events are not quantitative measures – they are characterizations of events in English.
- Risk metrics – This is where we turn a risk event into one or more metrics that quantify the impact of an event on the current or long term performance of a system. Risk metrics are not necessarily in the same units as the base performance objective. Risk metrics can be added to the objective using a scaling factor, or handled as limits.
In most applications, risk is captured as its own metric, which might be power outages exceeding some limit, a drop in the supplies of parts that would require a production shutdown, or events that lead to serious health outcomes. Most of the time the goal is to keep risk below some user-specified limit (we assume that we are always trying to reduce our risk metric(s)).
Interestingly, the mathematical literature on risk usually combines the base objective and the risk metric into a single utility function using a tunable risk parameter. While this may possibly be a valid approach to combining two metrics, we are not ready to make this assumption.
We note that while the base objective is always an average or sampled estimate of an average, a risk metric is often computed not as an average (or expectation), but rather as an event that may happen, possibly with a completely unknown probability.
At a point in time vs. over time
There is a vast literature on problems that make decisions over time. Inventory management is clearly a problem that has to be solved over time, balancing inventory holding costs with the possibility of stockouts as new orders become known. But what if we have a problem of assigning drivers to loads, or balancing an investment portfolio, or deciding where to build warehouses? In the 1950s solving any of these problems at a single point in time represented a major challenge.
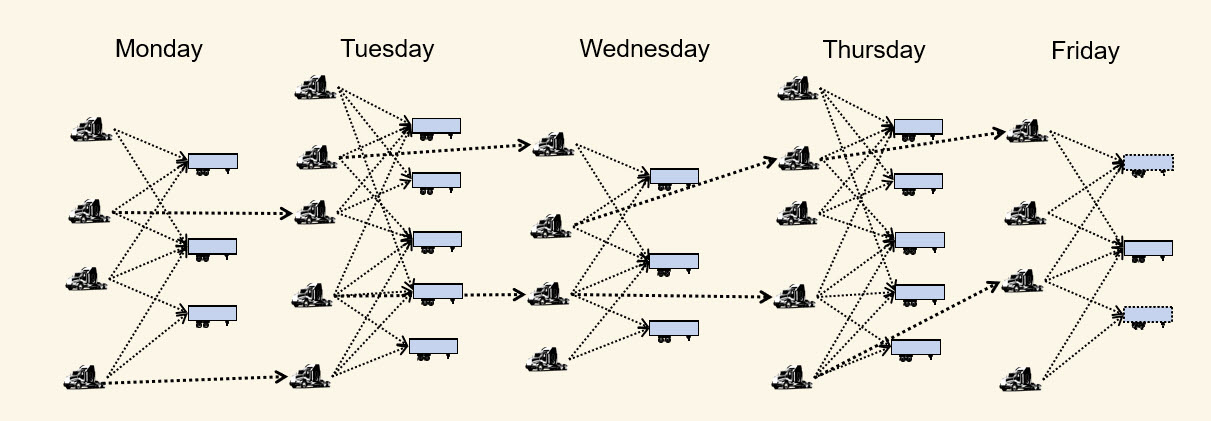
Today, we have software packages that can solve even large instances of these problems very quickly, but this still leaves us with the challenge of making decisions that work well over time. For example, assigning a driver to a load that goes to Montana, which is very isolated, can create problems when the driver finishes the load and needs to find another load. We have to think about whether we even want to accept the request to move this load, and if we do, which driver do we assign to it? Solving sequences of assignment problems is depicted in figure 3.3. Our stock portfolios have to work well even as asset prices vary over time, and warehouse locations have to anticipate future demand patterns.
At the time that this book is being written, we understand that inventory problems have to be optimized over time. However, the community that specializes in optimization models for complex problems, such as the driver assignment problem, portfolio management problem, and warehouse location problem, each have to reflect the effect of new information, and the impact of decisions now on the future. We have powerful software packages to solve these problems at a point in time, but nothing to optimize performance over time.
When we have problems that have to be solved repeatedly we have to capture:
- The impact of a decision now on later decisions.
- The arrival of new information that we did not know in advance.
The arrival of new information introduces a significant complication when making decisions over time (and virtually all problems that are solved over time have to do so in the presence of new information). For example, in our assignment problem the new information might be the arrival of new loads to be moved. The new loads to be moved on Tuesday would not be known when we are making decisions on Monday. As a result, if we are assigning drivers on Monday, the loads that might be called in on Tuesday are uncertain. We might also say that the loads to be called in the future are “random” (or “stochastic,” a term favored by the mathematical modeling community).
For the problem of optimizing the assignment of drivers to loads, we have to capture the arrival of new loads, and how the driver assignments on previous days affects the status of drivers today. To evaluate performance, we would run a simulation that would consist of the steps:
- Start by solving the problem on Monday with the loads that are known at that time.
- Step forward to Tuesday, and then observe the loads that happen to be called in.
- Optimize the assignment of drivers to loads on Tuesday using what is known.
- Step forward to Wednesday and repeat the process.
- Repeat until we reach the end of our simulation period.
Now imagine that we repeat this entire process again starting over on Monday, but as we step forward, we sample different sets of loads being called in. This means that we could simulate making decisions over time, and we would get completely different results.
There are different ways of making decisions to assign drivers to loads that might account for the impact of decisions now on the future. Imagine we have three methods. We could evaluate each method by running repeated simulations and then taking an average. For example, we might perform 20 simulations of each method for making decisions and use this average to evaluate the methods.
Problems that involve making decisions over time are routine; in fact, it might be the case that they represent the vast majority of decision problems. Every single application in Chapter 2 is a sequential decision problem. For example:
- Inventory planning – We have to repeatedly order inventory which arrives after some (typically random) lead time, during which we still have to satisfy orders that arrive. The rule we use to place orders (typically known as an “inventory policy”) has to be evaluated over time. If lead times are, say, three months, we would need to simulate the policy for several years, and do this repeatedly.
- Pricing and advertising decisions have to be made over time, as we observe how the market responds to these incentives. A decision at one point in time yields information (such as market response) that can be used to inform future advertising choices. At the same time, these decisions deplete the advertising budget.
- Decisions for generating and storing power have to be made over time as we observe variations in the weather, generator failures, and how the public responds to changes in the weather. Decisions about which generators to turn on or off changes the physical state of the system in the future.
- Medical treatments involve decisions about running tests and experimenting with different treatments to see how the patient responds.
- The allocation of naloxone pens to handle opioid overdoses have to be made over time as we observe how health officials and drug users adapt to the availability of this resource.
- Presidential campaigns have to make decisions about advertising and scheduling candidate visits while looking at polls to see how voters are responding.
- Mutual fund managers have to adjust how much cash they keep on hand while observing changes in the market, and the pattern of deposits and withdrawals that their customers are making.
It is somewhat surprising that while the literature on solving static decision problems is incredibly mature, the academic research community that works on these problems has not adopted a standard framework for modeling and solving sequential problems.
We are going to return to these issues in Volume II when we start using a little notation. Without notation, the discussion reduces to a lot of hand-waving.
Psychological performance metrics
Virtually the entire optimization literature assumes that there is a well-defined performance metric, called the objective function, that can be used to evaluate decisions. The objective function may not be known exactly, but we assume that the uncertainty can be quantified or at least sampled. By contrast, most of the literature on the psychology of decision making focuses on how people evaluate complex alternatives, which is probably explained by the fact that these are the most interesting and challenging decision problems.
In this section we will start by identifying some complex metrics, followed by a sampling of theories of how people handle these complex metrics. We close with a brief discussion of how brains “optimize.”
Complex metrics
Some examples of complex decision problems from the applications in Chapter 2 include:
- What is the best supplier for a complex component for a jet engine that requires special expertise in materials?
- What is the best way to market a consumer product to maximize sales?
- What is the best medical treatment to handle stage 3 lung cancer?
- What is the best allocation of resources in a presidential election (marketing, trips to give speeches).
- What is the best strategy to market a complex dispatch system to truckload motor carriers?
Each of these can be presented as an example of an “intelligent trial and error” problem (see the Intelligent trial and error section of Chapter 2) where there is a set of discrete choices. What makes these choices hard is a) they are important and b) we have considerable uncertainty about how well each will perform.
We can divide problems with complex alternatives into three classes:
- We know the metrics we want to use, but do not know their values.
- There are multiple metrics, but we do not know (precisely) their relative importance.
- We are not even able to articulate some or all of the metrics to evaluate each choice.
The first class has attracted considerable attention from the optimization literature, but it remains a very common context that people face frequently, where they fail to use the best methods for handling uncertainty. The second is another common topic and typically involves posing different alternatives to a decision-maker who is then asked to make a choice. The third is a common problem in the psychology literature since there are problems (such as those listed above) where someone may have a gut feel for what choice they want to make, without being able to articulate why it is best.
Some theories for metric formation
Examples of different theories for evaluating alternatives include:
Prospect theory - Key principles of prospect theory include:
- Loss aversion – People feel the pain of losses more intensely than the pleasure of equivalent gains. For example, losing $100 feels worse than the joy of gaining $100.
- Reference dependence – Decisions are made relative to a reference point rather than absolute outcomes. Gains and losses are perceived in relation to this reference.
- Risk aversion in gains, risk seeking in losses – When faced with potential gains, people tend to prefer certain outcomes over risky ones. However, when dealing with losses, they often take greater risks to avoid a definite loss.
- Diminishing sensitivity – The impact of changes in wealth decreases as amounts grow. The difference between losing $100 and $200 feels more significant than between losing $1,000 and $1,100.
- Probability weighting – People overestimate the likelihood of rare events (e.g., winning the lottery) and underestimate the probability of common events.
Mental accounting theory - This refers to the way people mentally organize, categorize, and evaluate financial decisions by creating separate “accounts” in their minds, rather than treating money as fully interchangeable/fungible. Some key concepts include:
- Categorization: People assign money to different mental budgets (e.g., rent, groceries, entertainment) and often make spending decisions based on the category rather than overall financial position.
- Framing: The same amount of money can be valued differently depending on how it was acquired — for example, a $100 windfall may be spent more freely than $100 earned from work. This explains why some people might splurge with a tax refund while being strict about everyday expenses.
- Sunk cost fallacy: People often continue with a losing endeavor (like attending a bad concert they paid for) because they have mentally “spent” the money, even though it is unrecoverable.
Attribution theory - Attribution theory explains how people interpret the causes of their own and others’ behavior, especially in achievement contexts like success or failure. For example, consumers assign reasons to their purchasing decisions, influencing brand perception and loyalty. Three dimensions of causal attributes include:
- Locus – Is the cause internal (e.g., ability, effort) or external (e.g., luck, task difficulty)?
- Stability – Is the cause stable (consistent over time) or unstable (variable)?
- Controllability – Can the person control the cause (like effort), or is it uncontrollable (like innate ability or luck)?
These attributions influence emotions and future motivation. For example:
- Attributing success to internal, controllable factors (like effort) boosts motivation and pride.
- Attributing failure to internal, uncontrollable factors (like lack of ability) can lead to shame and discouragement. Weiner’s theory is widely used in education, sports, and organizational settings to understand how beliefs about causes shape behavior and performance.
How the brain learns to optimize
There has been a tremendous tendency to attribute intelligence to the neural networks that are used to learn word patterns. While recognizing patterns is in fact an important form of intelligence, it is distinctly different from the process of making decisions, which humans are quite capable of doing. Making decisions requires the ability to maximize rewards that are specific to achieving some goal that might be related to eating, being comfortable, avoiding pain, winning a contest, or solving a problem.
It turns out that the brain has very specific functions that help with optimizing an objective that has nothing to do with simply matching a pattern. This is done with parts of the brain known as reward receptors, which are specialized proteins that respond to neurotransmitters, such as dopamine, to help the brain experience pleasure, motivation and positive or negative reinforcement. Neurotransmitters are like molecular locks that are activated when the right chemical key binds to them, which then triggers neural activities that guide behavior.
Types of reward receptors are:
- Dopamine receptors – These are the most important elements of the reward system, which come in different forms:
- D1 receptors, which promote reinforcement learning and help maintain long-term motivation.
- D2 receptors, which are involved in social bonding and mood regulation.
- D3 receptors, which play a role in motivation and goal-directed behavior.
- Opioid receptors – These respond to endorphins and other natural opioids, contributing to feelings of euphoria and pain relief.
- Serotonin receptors – These influence mood and emotional reward and are often used as a target by antidepressants.
- Glutamate receptors – These help encode reward-related learning and memory.
Obviously any discussion of these incredibly complex mechanisms is far beyond the scope of this book. The point we are making is that the brain has specific mechanisms for maximizing rewards, which is how it can choose the best decision. This is a process that is distinct from the brain’s powerful mechanisms for identifying patterns. By contrast, the neural networks used by large language models are trained to identify patterns or text; these use a single objective function, which captures the similarity between a function (the neural network) and the training dataset.
Setting performance goals for others
An important dimension of metrics is setting goals for the purpose of evaluating the performance of people or groups. This inherently implies a multiagent setting, where one decision-maker has the authority to set performance goals for another unit in an organization. In a multiagent setting, a goal of one agent may be the decision made by another (presumably higher level) agent.
The setting of goals is a particularly rich area in the context of organizations with multiple decision-making units, typically organized in a hierarchical fashion. We will return to this topic in a future volume.
Exercises
Review questions
- Name five examples of performance metrics.
- What is meant by objectives, targets and limits? Give an example of metrics that would fall into each of these three categories. You may use metrics from any of the examples in Chapter 2 (they do not all have to come from the same example).
- What is a risk event? Give examples of risk events if you are:
- The operator for the power grid for a region.
- A physician working with a patient to manage their diabetes.
- The chief financial officer for a supply chain.
- Name two theories for how people evaluate choices.
- Name four receptors that the brain uses to reward specific behaviors.
- For each of the examples of risk events in exercise 3, design a risk metric for that event.
Modeling questions
For each question below, design a metric pyramid using the metrics provided for the designated application, given the decision maker specified.
- You are a supply chain manager in charge of picking suppliers for the components of an air conditioner. Suppliers may be anywhere in the world.
- You have to restock inventories of different types of furniture for a furniture retail outlet.
- You have to plan investments in new power generating capacity (these orders are placed up to five years in the future).
- You are the revenue manager for a hotel.
- You are the physician choosing the treatment for a diabetic patient.
- You are the state official who has to allocate naloxone kits across counties in your state.
- You are a drug company who has to choose which drugs to put into Phase II trials.
- You are the campaign manager for a presidential election.
- You are the vice-president of operations for a truckload carrier who has to manage dispatchers (who assign drivers to loads) and load managers (who handle which loads to move).
- You are the mutual fund manager who has to determine how much cash to keep on hand.