Chapter 2: Applications
The first step in improving any product, process or service is to provide a basic description, and then identify possible performance metrics, types of decisions, and sources of uncertainty. We are going to illustrate these first steps using a variety of application settings. We are then going to draw on these applications throughout the rest of the book to illustrate different modeling devices.

The beauty of sequential decision problems is that they arise throughout activities that involve people. Figure 2.1 is a snapshot of some of the problem settings that describe the activities of the author, and which served as the motivational foundation for the work in this book. Each picture represents a host of decision problems. This is in sharp contrast with problem classes such as linear, integer, and nonlinear programming, which are important and powerful tools, but which solve only a very narrow subset of decision problems.
We note that there is a natural bias to focus on the management of physical resources since this is what we see. To be sure, managing physical resources poses many opportunities for making better decisions, but there are other decisions that directly address collecting information, along with managing the often significant flows of money required to support these operations.
In this chapter we are going to review the following problem settings:
- Inventory planning
- Demand management
- Electric power management
- Hotel revenue management
- Health applications
- Presidential elections
- Truckload fleet management
- Mutual fund cash management
- Supply chain finance
- Intelligent trial-and-error (many settings)
Many of these can be described as meta-problem domains, since they contain subareas which by themselves represent major fields of human activity. Our goal is to create a diverse set of applications, partly to illustrate the range of problems that fall under the umbrella of sequential decision problems, and partly to provide a diverse set of decision settings that will motivate the modeling framework that we will present in the remainder of the book.
At this stage we are not ready to describe complete models – that will come in Volume II. For each application, we are going to offer answers to the three questions in the framing process, recognizing that this is just a sample to get the reader thinking about the process.
Getting started – framing the problem
It is very common to discuss complex problems using general terminology. Figure 2.2 (prepared by ChatGPT) answers the question:
Prepare a 1-page discussion of how a company should respond to a sudden increase in tariffs that will disrupt their supply chain.
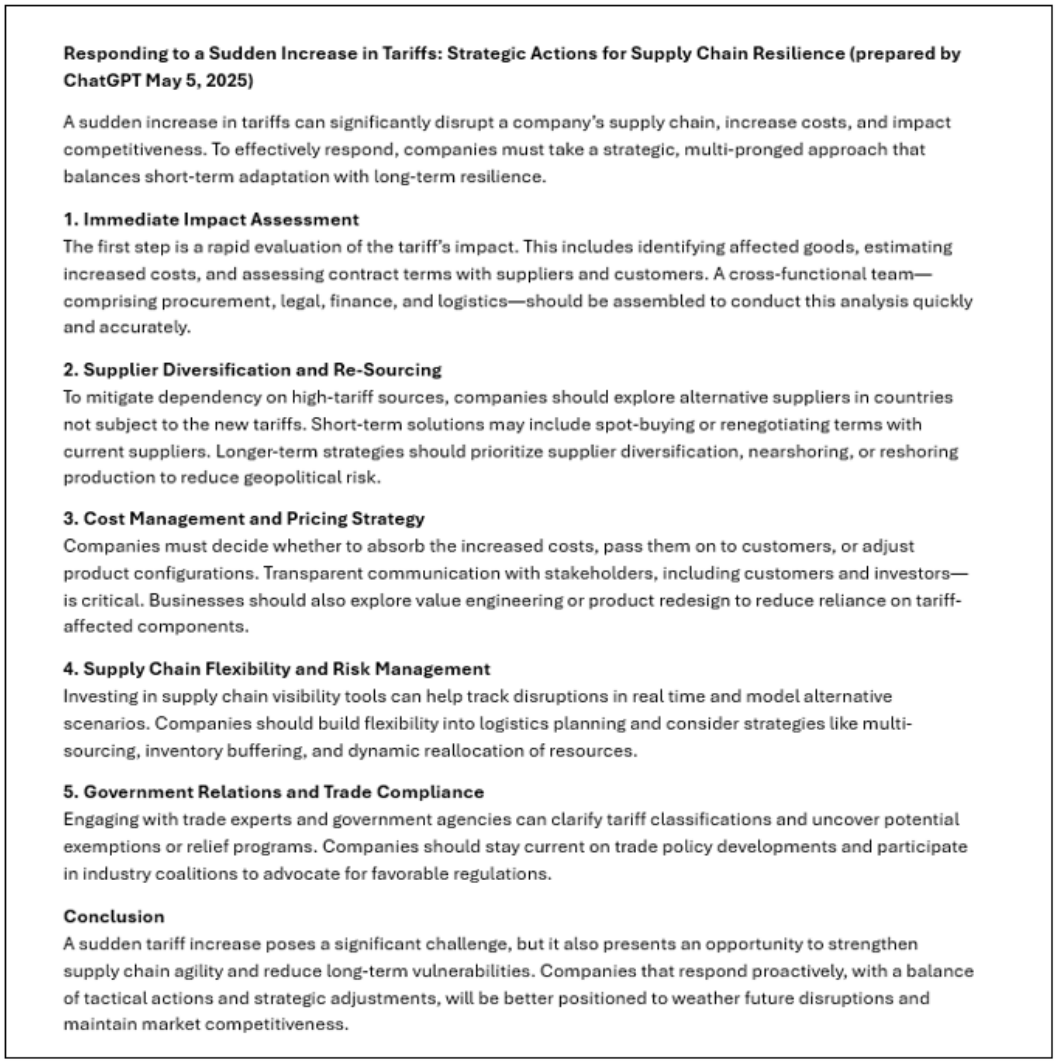
The problem with these general discussions is that they never provide a clear pathway to improving the process. Everything in the discussion is probably true, but it lacks specific actions that can be taken to solve a problem. The response provided by ChatGPT (in 2025) reflects the type of generic chatter widely found in business books, which could never be the basis of a formal model.
This chapter illustrates the first stage of framing the problem, which consists of four elements:
- The narrative: This is a short discussion that describes a problem in the style that might be used by someone within the problem domain.
- Performance metrics: We provide a list of performance metrics which will need to be prioritized (this is covered in Chapter 3).
- Decisions: Next we provide a list of decisions that impact one or more of the metrics. Decisions are covered in Chapter 4.
- Uncertainties: Finally, we describe the forms of uncertainty that can distort the effect of a decision when implemented, or as the process progresses forward in time. Uncertainties are covered in Chapter 5.
At this point we are not going to attempt to describe how we might solve the problem (that is, make the decisions). For this, we need other material that will be developed later. The goal at this stage is to use a variety of problem settings to illustrate the process of identifying metrics, decisions and uncertainties in a general way. Identifying these three elements is the key to solving any decision problem, so we have to develop the habit of them first.
Capturing interactions
While the identification of metrics, decisions and uncertainties is a valuable starting point, it is also important to understand how they interact.
- The effect of decisions on metrics – Each decision should have some impact on at least one metric, and every metric should be affected by at least one decision.
- Uncertainty in the performance metrics given the decisions – We might want the shortest path, but the travel time depends on congestion; we might want to choose a drug that will reduce an infection, but a patient may not respond to a particular medication; an investor cannot predict the exact return when purchasing a stock.
- The uncertainty may constrain what decisions we can make – A trucking company has to move loads, but these are called in at random; a hotel may hold back rooms for business travelers who may or may not reserve rooms; a utility may count on energy from wind, but the amount of energy that can be generated is uncertain.
- The uncertainty changes the dynamics of how the system evolves over time – The disease in a population may spread in an uncertain way; the economy may evolve in an uncertain way that affects the value of the dollar; uncertain competitor behavior can decrease sales.
Impact of decisions on metrics
A useful exercise is to create a spreadsheet where different decisions are listed on the left and metrics are listed across the top. Then, using pure judgment, enter one of the following in each cell to capture what you think describes the impact of each decision on each metric:
- H – Decision has a high impact on the metric.
- M – Decision has a medium impact on the metric.
- L – Decision has a low impact on the metric.
- N – Decision has no impact on the metric.
Table 2.1 illustrates how this might look for a small inventory problem. The spreadsheet can be downloaded from tinyurl.com/InteractionMatrix/.
| Decisions \ Metrics | Sales revenue | Product costs | Holding costs | Stockouts |
|---|---|---|---|---|
| When/how much to order | H | H | M | M |
| Purchase currency hedge? | N | L | N | |
| Discounting | M | N | L | M |
| Market product on social media | H | L | L | M |
Start by listing the metrics from left to right in order of importance. We are then going to use the matrix to identify the most important decisions, and the metrics that are most impacted by the decisions you have listed.
The interaction matrix can be used in two ways:
- List all decisions, and then assess the impact of each decision on each metric. From this, identify the decisions that seem to have the greatest impact on the most important metrics.
- For complex problems, listing all decisions may be impractical. Instead, use the set of metrics to help identify the decisions that are most relevant to the problem. Then return to (1) to help prioritize the most important decisions.
The exercise of filling in tables such as this can help guide the process of understanding the role that decisions play in improving performance, before moving forward with the expensive and complex step of collecting data and building a computer model.
Impact of uncertainty given the decision
Imagine that we have made a decision (which means it is fixed). We need to understand the forms of uncertainty that affect the metrics produced by the decision. For our simple (short lead time) inventory problem, we might obtain the matrix given in table 2.2.
| Uncertainty \ Metrics | Sales revenue | Unit costs | Holding costs | Stockouts |
|---|---|---|---|---|
| Sales (units sold) | H | L | M | M |
| Lead times | L | L | M | H |
| Forecasting errors | L | N | M | M |
| Inventory shrinkage | M | N | N |
Modeling uncertainty simply means understanding information that may arise in the future which we do not know yet. This simple observation is often overlooked in discussions of uncertainty, which can become buried in sophisticated mathematics (“stochastic modeling”) and the quantification of risk (which few understand).
As with decisions, we can start by listing every source of uncertainty that we can think of, and then use the interaction matrix to prioritize the ones that are most important. Alternatively, we can use our set of metrics to help guide the identification of important sources of uncertainty.
Impact of uncertainty on decisions
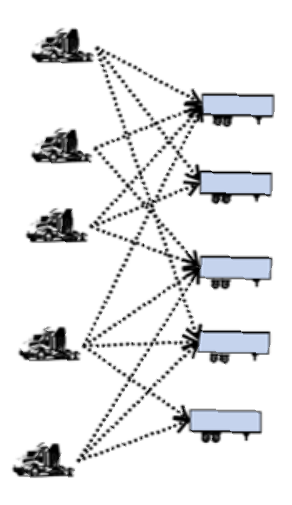
The most common setting where uncertainty impacts what decisions you are allowed to make arises in the context of resource allocation problems where we are managing some resource (people, machines, product supplies, drugs) to serve tasks (jobs, patients, customers). In figure 2.3 we are illustrating the assignment of trucks (with drivers) to move loads of freight. The main source of uncertainty is the flow of loads being called in by shippers to be moved, but this could be any task. We might assign a driver to a load that is not attractive in terms of profitability, but which ties up the driver for several days, preventing him from being used on a better load that might be called in later in the day.
The flow of customer requests is a major source of uncertainty that arises in:
- Supply chain management (demand for products).
- Health (patients needing treatment).
- Hotels (requests for rooms to rent).
- Energy (the demand for electricity or gas for heating).
- Finance (deposits and withdrawals of cash).
An important characteristic of the flow of demands that need to be served is how these demands become known to the system. Some variations include:
- No advance warning, immediate service (sales of any retail product).
- No advance warning, backlogging possible (online purchases).
- Advance request, immediate commitment required (booking of hotel rooms).
- Advance commitment with cancellation terms (expensive purchases, such as aircraft).
There can also be uncertainty in the availability of resources used to satisfy customers:
- Doctors, nurses may be ill.
- Machinery may fail.
- A truck driver can decline an assignment to move a load.
- An investment may decline in value.
Uncertainty in system dynamics
Whatever we know at one point in time may change as we step forward in time, and if it changes, we are typically unsure about how it is changing. Some examples of uncertainty in the evolution of the system include:
- Changes in costs, prices and other performance metrics.
- Changes in the status of people, equipment and facilities over time. People may quit or get sick, equipment may break down, a facility may be damaged in a storm.
- Changes in market attitudes, the presence of disease in a population, how people might vote for a candidate.
It is important to recognize that uncertainty about how the system evolves over time can be divided into two categories:
- Uncertainty in the function describing the evolution of the system. Some refer to this as “model uncertainty.” If we are managing the distribution of vaccines, we may use different models for how the disease propagates through the system. When we are planning evacuations for a hurricane, we can choose from different models of how the storm will progress.
- Uncertainty in the parameters that determine the behavior of the function.
Uncertainty in forecasts
There are many problems (but not all) where making a decision now requires projecting what might happen in the future. Of course, the future is almost always uncertain, but it is our choice whether to use a “best estimate” of what might happen in the future, or to explicitly model this uncertainty to help us make a decision now. We return to this issue in Chapter 4 when we discuss ways of making decisions.
Comments
Uncertainty is easily the most subtle issue when understanding a decision problem. Often people have an intuitive sense that a type of uncertainty is important; this section helps to refine how a form of uncertainty actually impacts a decision problem.
Inventory planning
Narrative
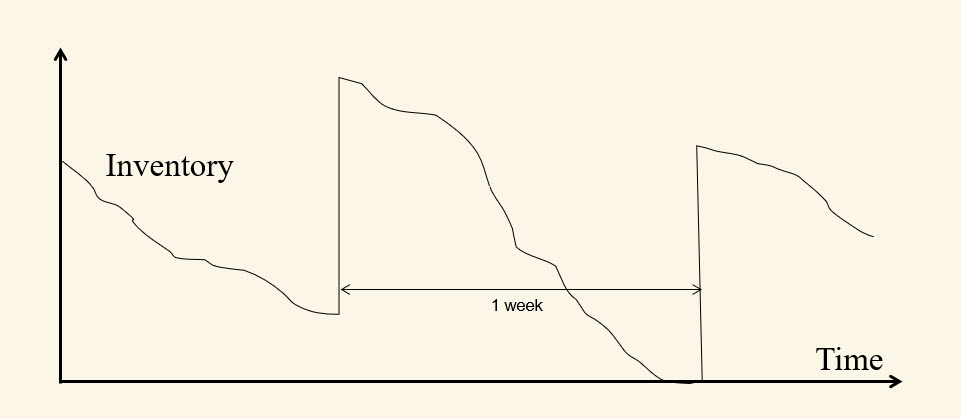
One of the most widely studied problems in operations research (as well as stochastic optimization) is the inventory problem, which is typically posed as determining when to place an order to replenish, and how large the order should be. The classical textbook description of an inventory replenishment problem is depicted in figure 2.4, which shows the increase in inventories when new product arrives, followed by the depletion as product is consumed. A stockout, where inventory drops to zero, is depicted.
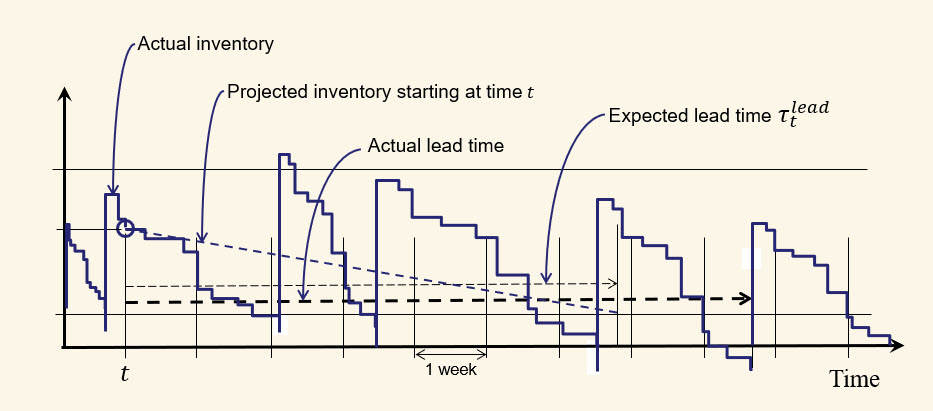
A more realistic version of an inventory problem is illustrated in figure 2.5, which depicts an inventory problem that might arise in a setting where the product is coming from a distant location (such as from China to the eastern U.S.). We might have to wait 6-8 weeks, but weather delays can extend this even more. Long-distance shipping typically involves movement by ocean container ships for port-to-port moves, rail (common within the U.S.) and then truck.
Planning inventories has to be coordinated with strategies for managing demand, which can be influenced through pricing, discounts, promotions, and marketing. Inventory management has to deal with a number of sources of uncertainty, ranging from the usual day-to-day variability in demand, to market shifts due to competitor behavior, new technologies, and both losing suppliers as well as the emergence of new sources of supplies. In addition, there can be significant variations in transportation times due to weather, mechanical failures, and labor actions at ports. Excessive delays may be managed by using fast modes such as air freight as an alternative to container shipping, and truckload trucking as an alternative to rail.
Metrics
We separate metrics between “base metrics,” which are captured through routine reporting, and “risk metrics” that specifically account for significant events (typically negative) which, in the judgment of management, are not properly captured in the base metrics.
- Base metrics
- Inventory holding costs, which cover a range of items including cost of the capital tied up in inventory, warehousing costs (heating/AC, manpower handling, overhead of the warehouse and equipment), insurance costs, cost from spoilage, theft, obsolescence.
- Shipping costs, including packaging, transportation and insurance.
- Revenue from meeting demand, which needs to reflect any discounting.
- Forecasting accuracy metrics.
- Customer service metrics, such as delayed or lost demand that is not met from lack of inventory, and product returns (e.g. due to quality issues).
- Cost of promotions, coupons, marketing and advertising.
- Utilization of facilities (are they full?), people and equipment.
- Labor issues, including labor productivity, need for overtime, hiring costs and layoffs.
- Risk metrics
- Currency risks when the product is purchased from another country in a different currency.
- Significant stockouts that force customers to competing products.
- Theft, cyberattacks.
- Significant disruptions (interruptions at a supplier, damage to facilities) that prevent delivery to customers or employment.
Decisions
It helps to organize decisions based on whether we are solving a single inventory problem, or addressing network level issues. Textbook inventory models typically focus on operational decisions such as when to place an order and how much. However, the perspective changes when we have long lead times, where a decision now impacts the system months into the future.
The list of decisions that are relevant to inventory planning is quite long. In the interactions section below we are going to use a tool we call “interaction matrices” to identify the most important decisions.
| Physical | Financial | Informational | |
|---|---|---|---|
| Whether to observe/verify inventory | ✓ | ||
| Who from the set of available suppliers to place the order (if there are multiple suppliers) | ✓ | ||
| When to place a replenishment order. | ✓ | ||
| How much to order. | ✓ | ||
| How to package it (ocean container, half-container, pallets, boxes). | ✓ | ||
| How to finance order (cash transfer, bank loan, ...) | ✓ | ||
| The choice of transportation modalities for products from abroad to intermediate storage facilities | ✓ | ||
| The choice of transportation modalities for domestic distribution to customers | ✓ |
| Physical | Financial | Informational | |
|---|---|---|---|
| Whether to purchase currency hedges for products from abroad. | ✓ | ||
| Discounts/promotions (to reduce inventory) | ✓ | ✓ | |
| Product pricing. | ✓ | ✓ | |
| Marketing/displays (shelf space, end-cap display, advertising (various forms)) | ✓ | ||
| Running market tests for features, design, ... | ✓ | ||
| Design and implement marketing campaign | ✓ | ||
| Choice of supplier (for each material or component), including whether to have multiple suppliers. This determines the possible suppliers. | ✓ | ||
| Equipment maintenance (increases scheduled downtime, decreases unscheduled down time) | ✓ |
| Physical | Financial | Informational | |
|---|---|---|---|
| Contracts with inventory visibility platforms (where is my shipment)? | ✓ | ||
| Choice of demand forecasting methodology (statistical methods, involvement of different people across the organization). | ✓ | ||
| Product design (which determines the required materials and components) | ✓ | ||
| Market identification (who are we selling to) | ✓ | ||
| How much connectivity (information sharing) to seek with manufacturing supply chain partners | ✓ |
Single inventory problem
These decisions are made on different time scales: operational (hourly, daily, weekly), tactical (monthly), and strategic (quarterly, yearly).
- Operational - These are decisions that might be made in real-time, but are typically made either daily or weekly (table 2.3).
- Tactical - Decisions made on a monthly basis (table 2.4).
- Strategic - Decisions made on a quarterly or yearly basis (table 2.5).
Supply chain design
There are decisions related to the design of supply chain networks that cut across many (tens to thousands) of individual inventory decisions. These are decisions that are typically made on longer time scales. Table 2.6 provides some examples of network-level decisions for designing the supply chain.
| Physical | Financial | Informational | |
|---|---|---|---|
| Where to locate buffer stocks and how to rebalance them | ✓ | ||
| Closing existing facilities | ✓ | ||
| Where to purchase/lease/build/expand manufacturing facilities | ✓ | ||
| Which manufacturing facilities to close/sell, terminate leases | ✓ | ||
| Where to purchase/lease/build/expand warehouses and distribution centers | ✓ | ||
| Whether to introduce materials handling automation in DCs and warehouses | ✓ | ||
| Investment in information technologies for information sharing and coordination | ✓ | ||
| Arrange significant line of credit or other source of backup financing | ✓ |
Uncertainties
Uncertainties also occur on different time scales. We include a special category for major disruptions that may occur, but not on a regular basis.
| Physical | Financial | Informational | |
|---|---|---|---|
| Day-to-day variations in customer demands | ✓ | ||
| Errors in measuring inventories | ✓ | ||
| Inventory "shrinkage" (theft, loss, spoilage, breakage, ...) | ✓ | ||
| Yield from shipment (how many items/how much material met specifications) | ✓ | ||
| Transportation delays due to weather, equipment failures | ✓ | ||
| Forecasting errors | ✓ | ||
| Cost of raw commodities | ✓ | ||
| Cost of inputs from suppliers | ✓ | ||
| Power (electricity, fuels) outages | ✓ | ||
| Communication errors, human execution errors | ✓ | ||
| Day-to-day variations in company stock price | ✓ | ||
| Financial fraud in individual transactions | ✓ | ||
| Day-to-day availability of available-to-allocate capacity | ✓ |
| Physical | Financial | Informational | |
|---|---|---|---|
| Shifts in the mean demand due to technology shifts, competitor behavior, market shifts | ✓ | ||
| Changes in the selling price of a product (affects demand and profit flows) | ✓ | ✓ | |
| Changes in commodity prices | ✓ | ||
| How the market responds to pricing changes | ✓ | ||
| Delays due to strikes at ports, railyards, international crossing points | ✓ | ||
| Shifts in behavior of large customers | ✓ | ||
| Shifts in attitudes on Wall St (e.g. from "growth" to "stable" to "recession") | ✓ |
| Physical | Financial | Informational | |
|---|---|---|---|
| Emergence of new information technologies (AWS, AI, visibility platforms) | ✓ | ||
| Emergence of new manufacturing/material handling technologies (e.g. robotics) | ✓ | ||
| Emergence of new competitors | ✓ | ||
| Shifts in population patterns (e.g. growth of immigration) | ✓ | ||
| Shifts in demand patterns (increase in demand for high-end products) | ✓ | ||
| Treaties governing trade | ✓ | ✓ | |
| Changes in labor availability | ✓ |
| Physical | Financial | Informational | |
|---|---|---|---|
| Emergence of new information technologies (AWS, AI, visibility platforms) | ✓ | ||
| Emergence of new manufacturing/material handling technologies (e.g. robotics) | ✓ | ||
| Emergence of new competitors | ✓ | ||
| Shifts in population patterns (e.g. growth of immigration) | ✓ | ||
| Shifts in demand patterns (increase in demand for high-end products) | ✓ | ||
| Treaties governing trade | ✓ | ✓ | |
| Changes in labor availability | ✓ |
(Note: table 2.10’s source figure renders identically to table 2.9 — flagged for you to check against the manuscript; the “major disruptions” row content may need to be swapped in from a different source file.)
Identifying the different sources of uncertainty is a particularly rich area for complex problems such as supply chains. Not only are there a wide range of uncertainties, they come in different styles such as fine-grained volatility, regime shifting, spikes, bursts and rare events. We discuss these behaviors in more detail in Chapter 5.
| Decisions \ Metrics | Sales revenue | Product costs | Holding costs | Stockouts | Inventory turns | Operating margin | Sales growth |
|---|---|---|---|---|---|---|---|
| When/how much to order | H | H | M | M | M | M | L |
| Purchase currency hedge? | N | L | N | N | N | M | N |
| Discounting | M | N | L | M | L | M | M |
| Market product on social media | H | L | L | M | M | L | M |
| Choice of supplier | L | M | L | L | L | M | L |
| Pricing | H | N | L | L | L | M | M |
| Currency hedges? | N | L | N | N | N | L | N |
| Inventory sensors | L | L | L | M | L | L | N |
| Use visibility platforms to track inbound product? | L | L | M | L | L | N | |
| Product design | M | H | L | M | M | M | H |
Interactions
A powerful exercise that helps with developing an understanding of the different elements of decision problems is to subjectively assess the strength of different types of interactions, an idea we first introduced in the capturing interactions section above. We start with describing the interactions between decisions and metrics for an inventory problem with long lead times, shown in table 2.11. We emphasize that filling out this matrix is completely subjective, since it helps us identify the most important decisions, as well as the metrics that we have the greatest chance of improving.
What we are doing is replacing what is often a completely invisible step of choosing what decisions to focus on, with a process that makes this choice explicit, even if it is made subjectively.
The interaction matrix for uncertainties and metrics given a decision might look like that given in table 2.12. Here, we make a point of holding a decision fixed to avoid blending the effect that uncertainty has on which decision we make.
| Uncertainty \ Metrics | Sales revenue | Unit costs | Holding costs | Stockouts | Inventory turns | Operating margin | Sales growth |
|---|---|---|---|---|---|---|---|
| Sales (units sold) | H | L | M | M | H | M | H |
| Lead times | L | L | M | H | M | L | M |
| Forecasting errors | L | N | M | M | M | H | L |
| Inventory shrinkage | M | N | L | N | M | L | N |
| Changes in commodity prices | N | H | N | N | N | N | L |
| Market response to price | M | N | N | N | N | M | L |
| Work stoppages | M | L | N | M | L | L | N |
| Competitor pricing behavior | M | N | L | L | L | M | M |
Demand management – selling furniture
Narrative
The flip side of managing the flow of goods through the different steps of manufacturing and distribution is the challenge of managing demand. The largest producers of furniture are China (by far), the United States (mostly for domestic consumption), Germany (mostly for Europe), Italy (high end furniture) and Poland (for lower cost furniture). Furniture sellers have to work with long lead times, highly seasonal demand and customization, as well as a competitive marketplace. While they will use all the usual tools to manage the flow of physical product, it is important to use various strategies for managing demand to help balance supply with the marketplace.
Some of the demand-side issues that furniture sellers must deal with include:
- Highly variable demand, due in part to variations in people moving into new homes.
- Evolving customer preferences as customers respond to design trends and changing styles, along with new products and materials.
- Price sensitivity, which reflects both the state of the economy and the competition.
- Market response to advertising and visibility in social media.
- Strategies for search engine optimization.
- Partnering with home décor influencers who can showcase products.
- The ability to offer discounts and promotions to reduce excess inventories.
Metrics
Metrics always depend on the perspective of who is being evaluated, but some that we would expect in this setting might be:
- Sales (in units, and total revenue).
- Net revenue – Sales, minus cost of goods and advertising.
- Stockouts, delayed order fulfillment.
- Web traffic – There are a number of metrics used to evaluate e-commerce portals such as visits, click-through rates, bounce rates, time on site, and conversions.
- Number of likes, shares, comments, as well as brand mentions and sentiment analysis in online discussions.
- Engagement – Use of virtual reality previews.
Decisions
We are envisioning that we are the outlet manager for a furniture store:
- Which furniture items to stock.
- Pricing.
- Promotions and discounts – e.g. discount for a furniture setting.
- What marketing channels to use – social media, TV, print mailings, in-store marketing.
- Marketing budgets for each channel.
- A/B testing of webpage designs.
- Conducting market surveys – offering specific packages at a subset of stores.
- Staffing decisions (how many, what skills).
Uncertainties
Some examples of uncertainties that might arise when selling furniture include:
- Deviations between actual demand and forecast for furniture at different levels of aggregation.
- Supply lead times.
- Product quality issues.
- Market response to price, discounts and promotions.
- Customer willingness to substitute products of higher or lower quality.
- Variations in consumer preferences.
- Variations in web traffic and conversion rates.
Electric Power Grid management
Narrative
Energy systems is an umbrella term spanning the vast network that supplies the energy that supports modern society. We are going to focus our attention on the flow of electricity, but this includes power generation that can come from different sources, primarily gas (but still some coal and oil), nuclear and a growing presence of energy from wind, solar and hydroelectric facilities.
The backbone of any electrical system is the power grid, which consists of high-capacity transmission lines that move power over long distances at high voltages, from 69kv (that is, 69,000 volts) up to 345kv, with ultra-high voltage lines as high as 765kv. Power is then sent to businesses and residences using local distribution networks with voltages between 4kv and 14kv.
Power comes from a “fleet” of power generators that may include nuclear, coal, steam generators and gas turbines, along with hydroelectric power (there is a strong imprint of naval vocabulary because of the presence of nuclear power). These generators are differentiated by the speed with which they can be turned on (“dispatched”) or off, and how readily they can be run faster or slower. The other important characteristics are the fixed cost and operating costs. For example, nuclear power is high fixed cost, low operating cost, and they have to be run continuously except for maintenance periods. Gas turbines have much lower fixed costs but higher operating costs, and they can be turned on in under an hour. Steam generators, on the other hand, need 8-12 hours to heat up, and as a result they are typically planned a day in advance.
The growing use of energy from wind and solar has introduced a degree of uncontrollable variability that power grids have not been exposed to before. The way this variability can be handled is with storage, which comes in different forms, but the most visible is grid-level battery storage. Australia and Florida are two regions that have invested heavily in battery storage, but this is starting to become a common investment accompanying the development of large solar fields and wind farms.
Storage, however, comes in other flavors, including:
- Pumped-hydro storage, where water is pumped uphill, and then used on demand to generate electricity by flowing downhill.
- Battery-to-grid storage, where the batteries in cars and residences are used as a form of battery storage.
- Thermal storage, where energy is stored by heating up a liquid in a large tank.
- Demand management (or demand response) – We can “store” the need for electricity by deferring activities such as running washing machines and driers or cooling down rooms (such as libraries) to use the cool air later.
Energy is a particularly rich problem domain in terms of managing different forms of uncertainty, using different technologies for generating power which require dramatically different time frames in terms of advance notification (literally from 2 seconds for varying the output of a gas turbine to a year for changes in maintenance schedules for nuclear power plants).
As this book is being written, the power grid has come under pressure to meet the growing demands from the use of “AI” tools, which require massive computing centers to handle the demands for calculating neural networks with tens of billions of parameters using the types of specialized chips from companies like Nvidia. There is also growth in the use of air conditioning to handle increasing temperatures, along with the computing demands of cryptocurrencies.
Metrics
Among the rich set of metrics for power generation would include:
- The cost of electricity – This is easily the most important metric used to evaluate energy systems, although this is for societies that can assume 24-hour availability of electricity. It is important to distinguish between the fixed cost of an investment (nuclear power plants are very different from gas turbines and solar panels) and the operating costs.
- Demand coverage/outages – There are some regions of the world that have access to electricity for only a portion of each day.
- Meeting temperature targets – People like to live in environments where the temperature stays in a narrow range. A building manager may face penalties for the periods when the temperature in an apartment falls outside of a specified range. Some food and drugs need to be refrigerated to certain temperatures, with penalties when these are violated.
- Impact on the environment, ranging from net CO2 emissions, heating water, consuming land, impact on local flora and fauna (the list is quite long).
- Reliability – The frequency and severity of outages.
Decisions
Decisions in the power sector span time frames from seconds (to smooth out voltage variations) to years, for long term agreements for purchasing power:
- Adjustment of power generators for frequency regulation, which occurs at 2-second intervals.
- Power purchase decisions (typically at 5-minute intervals) which may involve buying power from the grid or selling power back to the grid.
- Decisions to purchase or sell power given current grid prices.
- Purchase and storage of gas, oil and coal (in some cases, hydrogen).
- Installation of grid sensors to understand the state of transmission lines.
- Power purchase agreements, which are contracts to buy or sell power over multi-year periods.
- The location, type and capacity of energy generator, from gas turbines and nuclear power plants to wind farms and solar fields.
- The location, type and capacity of energy storage.
- Grid transmission capacity, which controls how much power can be transmitted at a point in time.
Uncertainties
Energy systems offer an exceptionally rich set of uncertainties that affect both infrastructure investments and the daily operation of the energy system.
- Weather, especially temperature and humidity, affects demand in a region.
- Wind direction and speed for wind turbines.
- Cloud cover that can change solar intensity.
- Generator failures due to weather events, mechanical failures, and sabotage.
- Grid prices, which can vary by both 5-minute intervals (the frequency of updates to grid prices) and 2-second intervals (for power regulation).
- Human activities such as a football game or concert.
- Regulatory changes that can affect tax incentives to penalties and outright restrictions (e.g. on offshore wind, or building new pipelines).
- The cost of equipment (solar panels, wind turbines, batteries, gas turbines, and nuclear power plants) evolves continuously over time.
- The emergence of new technologies, such as small nuclear power plants and new battery technologies.
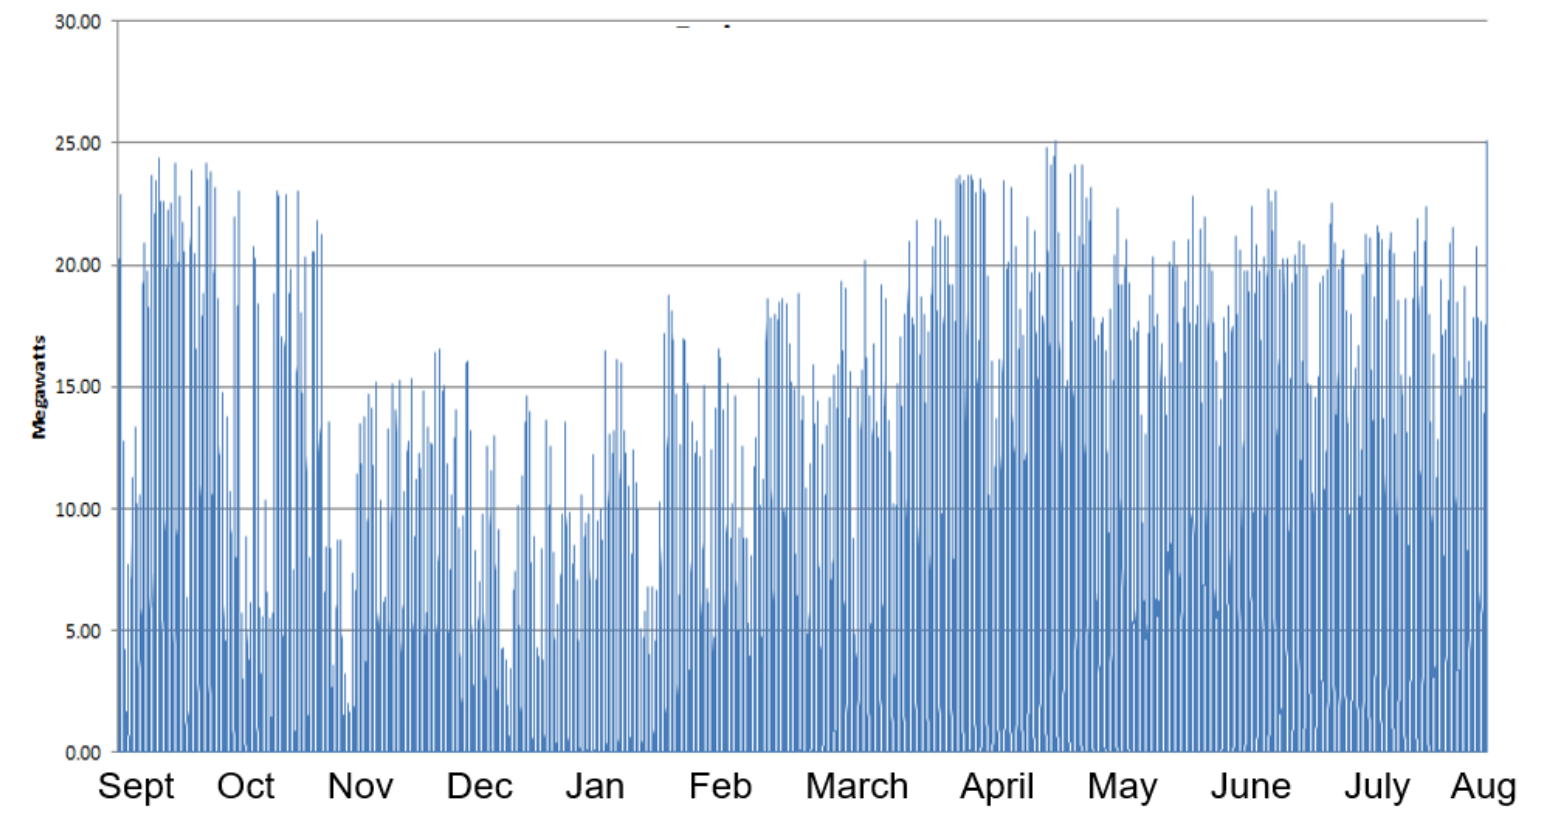
The emphasis on renewables has raised the visibility of uncertainties. Figure 2.6 shows solar output on an hourly basis, over an entire year, which communicates both seasonal variations, familiar daily cycles, and the effects of cloud cover. Of particular importance is the predictability of the different forms of uncertainty. We know when the sun will set decades in the future, but cloud cover is particularly difficult even on very short time horizons.
Hotel revenue management
Narrative
Hotels face the need to manage reservations for rooms for up to a year in the future, although most bookings arrive in the last few months, and in some cases, the last few weeks. As time passes, hotels can increase rates as the hotel fills up. Normally the hotel will start by offering lower rates, but these rates have to reflect the possibility that the hotel may fill up, which means possibly turning away people traveling on business with a much higher willingness to pay.
There is more to managing hotels than just the price charged for a room. Hotels can offer a variety of services, from free breakfast, access to gyms and pools, and tickets to local services such as ski slopes or travel tours.
An important advertising channel is on social media outlets such as Google and Facebook. These outlets run sophisticated auctions where advertisers have to bid dynamically for the right to post links to their webpage for a period of time.
Metrics
Some of the metrics for hotel revenue management include:
- Total revenue each booking day, minus the costs of services offered.
- Amount spent on internet ad searches (Google, Facebook, …).
- Room utilization.
- Declined customers.
- Unused rooms.
Decisions
The decisions that might be made by a hotel manager typically include:
- How much to charge for a room $\tau$ days into the future.
- Which e-commerce outlets to advertise on.
- How much to bid to have their ads posted on each e-commerce outlet.
- What services to offer at different rates.
- How to design the webpage.
Uncertainties
Hotel managers have to face several sources of uncertainty:
- Total bookings each day for a particular stay-date.
- The acceptance rate for a room given the price and service offerings.
- How often a bid to advertise is accepted given the size of the bid (or the bidding policy).
- The success rate for customers that see a webpage design.
Health applications
Health is a massive topic that literally touches every human being. We have a strong incentive to make decisions that maintain or improve our health, while keeping within budgets. The topics below are just a tiny snapshot of the rich set of decision problems that arise in this setting.
Managing Type 2 diabetes
Narrative
Approximately 10 percent of the global population has Type 2 diabetes, which reflects an inability to control blood sugar (glucose) levels in the blood. Type 2 diabetes arises when the pancreas does not produce enough insulin, or when the body becomes resistant to insulin. A failure to control the resulting elevated levels of blood sugar can produce a host of health conditions, including heart and kidney failure, damage to blood vessels in the eyes which can lead to glaucoma and blindness, foot problems from poor circulation (sometimes requiring amputation), and increased incidence of dementia.
Short term spikes in blood sugar (known as hyperglycemia), which may occur shortly after eating certain types of food, can produce blurry vision, headaches, fatigue, and difficulty concentrating. Drops in blood sugar (hypoglycemia) can produce dizziness, rapid heart rate, fainting, seizures, and even a coma.
Diabetes, then, is a disease that has to be managed both over the long term, as well as the short term. Elevated blood sugar over long periods of time can produce permanent organ damage, while short-term variations can create medical conditions requiring immediate treatment.
Metrics
As with most medical conditions, a number of the metrics capture the state of the patient, but there are others.
- Blood sugar, measured in mg/dL (typical range is 70-130), or mmol/L (typical range 3.9-7.2), which is an instantaneous measurement often taken after meals.
- Fasting blood sugar – This is the blood sugar level after 8 hours of fasting.
- Time in range (TIR) – This is used with continuous blood sugar monitors and measures the time that the blood sugar stays within an acceptable range.
- Time above range (TAR) and time below range (TBR) – Percent of time the blood glucose level is above or below the acceptable range.
- Hemoglobin A1c (HbA1c) – This test reflects a rolling 2-3 month average, where desirable values are under 6.5 to 7 percent.
- Glucose variability – The standard deviation of the blood sugar.
- The cost of treatment (physician visits and medications).
- Frequency of need to visit a physician.
- Medical consequences from diabetes, spanning foot pain (neuropathy), vision loss, amputation and death.
Decisions
We deviate from our normal style of just listing decisions, and list medical decisions made by the physician separately from the decisions made by the patient.
Medical decisions (made by the physician)
- Choice of drugs, dosage levels and timing. Metformin is the standard drug of choice, used by 50 to 80 percent of patients who are taking medication. However, many patients cannot tolerate it, and have to turn to a range of other medications including insulin, sulfonylureas, meglitinides, DPP-4 inhibitors, and so on.
- Prescribing technology-assisted treatments, such as
- Continuous glucose monitoring devices.
- Insulin pumps, which provide precise insulin delivery.
- Automated insulin delivery systems.
- Surgical interventions, such as bariatric surgery and pancreatic islet transplantation.
Patient decisions
- Seeing a physician.
- Following physician instructions.
- Submitting to testing, investing in home testing equipment.
- Administering drugs.
- Diet choices – This of course represents a wide range of decisions affecting the type of food and quantity.
- Exercise choices – What type, how frequently, how intensely.
Uncertainties
- Side effects of a medication.
- How well does a patient respond to a medication (change in blood glucose level).
- How well a patient adheres to a diet and exercise program.
- Patient ability (and willingness) to follow treatment instructions.
- Long-term progression of the disease as a patient ages.
- Availability of new medications.
Public health – Managing naloxone kits
Narrative
While drug use and overdoses have been a problem for decades, there was a dramatic spike in overdose deaths due to synthetic opioids starting around 2013, quickly outpacing deaths from all other drugs by a wide margin. Much of this increase was due to the introduction of Oxycontin by Purdue Pharmaceuticals in 1996. Oxycontin contained oxycodone, which was less addictive than other painkillers.
Oxycodone had a long-lasting formulation that did not provide the quick “hit” that drug users were looking for. However, the public found that the drug could be crushed and misused, a practice that exploded in use after 2013. Below we summarize the metrics, decisions and uncertainties from the perspective of a public health officer working for the state or municipal government.
Metrics
- Number of opioid overdoses where:
- No one present had naloxone (person survived or died).
- Naloxone was present, but naloxone was not administered (person survived or died).
- Naloxone was administered (person survived or died).
- Number of overdoses where EMS responded.
- Number of overdoses where person had to be transported to the hospital.
- Cost of the naloxone kits.
- Cost to healthcare system.
- Overdose is handled outside of the hospital (e.g. by EMS).
- Overdose requires transporting person to the hospital (very expensive).
- Enforcement costs.
Decisions
The decisions below are from the perspective of the state government:
- How many naloxone kits should be allocated to different types of organizations:
- Harm reduction agencies, treatment providers.
- Direct services organizations.
- First responders (EMS, law enforcement, fire).
- Other community-based organizations that interact with people who use drugs (faith-based orgs, housing providers, food pantries, etc).
- Pharmacies, hospitals.
- Jails and prisons.
- How many kits should be allocated to needle exchange programs by region:
- Overdose hot spots.
- Rural vs urban.
- Different counties/regions.
- At risk populations, such as Tribal lands.
- Who to train on how to recognize and reverse an overdose? Who to train on how to use the kits?
- How to advertise the availability of naloxone kits?
- How to fund naloxone distribution strategy?
- Who to submit proposals to obtain funding?
Uncertainties
- Usage rates and patterns by people/patients. This is affected by:
- Awareness – people may not know that naloxone is available.
- Trust – people may not be comfortable disclosing that they need it.
- How people respond to opioid use and treatment.
- Availability of drugs in the market.
- Transportation barriers – people may not be able to get to a distribution point.
- Contaminants in the supply that have an unknown impact on naloxone and overdose reversals.
- Budget allocated for preventive measures such as naloxone kits and the staff capacity to distribute them.
Running clinical trials for drug testing
Narrative
As of 2024, there were almost 500,000 clinical trials testing various drugs and treatments for effectiveness. There are three phases of a clinical trial:
- Phase I: Safety and dosage testing ($5–$10 million) – A small group of healthy people are used to test for toxicity at different dosage levels and identify possible side effects. Researchers may also compare different methods of administering a drug, such as pills, patches or injections.
- Phase II: Evaluation of efficacy and side effects ($20–$100 million) - The treatment is applied to a larger group of patients who have the disease or condition that is the target of the treatment. Guided by what is learned in Phase I, this phase provides an initial indication of the effectiveness of the treatment. Side effects are observed, and the results will be compared to existing treatments.
- Phase III: Large-scale testing ($100+ million) – Using pools of hundreds, often thousands, of patients drawn from different regions, the treatment is compared to competing therapies to evaluate effectiveness and further observe for adverse reactions. Additional data is gathered for regulatory review.
Clinical trials are not only very expensive, they also take a lot of time. During this evaluation, the 20-year clock on patents is ticking, creating an incentive to draw a (hopefully positive) conclusion to go to market.
The process of running trials poses a large-scale logistical problem to administer the trials and requires substantial financing, which also means considerable financial risk. The entire process has to be conducted in the presence of considerable uncertainty about the performance of a drug or treatment on a large scale.
Clinical trials may fail at any of the three levels because of:
- Lack of efficacy – The drug does not work as hoped.
- Safety concerns – There may be significant side effects.
- Regulatory hurdles – The drug may encounter regulatory problems.
- Commercial or strategic reasons – A company may not pursue a drug because of financial projections, financial risk, or competitive issues.
Typical success rates are:
- Transition from Phase I to Phase II: ~60 percent.
- Transition from Phase II to Phase III: ~30 percent.
- Transition from Phase III to approval: 50-60 percent.
The overall success rate through the entire process is around 10 percent.
Metrics
There are a variety of metrics that go into the evaluation of a drug:
- Successful transitions from each of the three phases to the next stage.
- The cost of each phase.
- The cost of gaining regulatory approval at each stage.
- The effectiveness of the drug or treatment.
- The presence of side effects.
- Manufacturing cost of the drug.
- Cost of distributing the drug (it may require refrigeration).
- Cost of administering the drug. (By mouth? Injection?)
- Marketing costs.
Decisions
We describe decisions from the perspective of the company that owns the drug with an interest in bringing it to market:
- At each phase, each week there is a decision to continue testing, stop and terminate the review (the drug fails), or stop and transition to the next stage (success).
- How many patients to interview and invite to become a part of the trial.
- Choice of hospitals to use as clinical testing locations.
- Decision to open testing locations (e.g. in a strip mall).
- Pricing of the drug.
- Marketing strategies: To physician? Direct to the market?
Uncertainties
Decisions have to be made while keeping the following uncertainties in mind:
- The rate at which eligible people can be identified.
- The response of people to the treatment.
- The decisions of regulatory committees.
- Anticipated acceptance of the drug by physicians.
- Decisions made by competitors that can affect the sales of the drug.
Running a presidential election
Narrative
Anyone who has watched the series “West Wing” (or carefully follows presidential elections) has seen the challenge of managing a presidential campaign. Invariably it is a complex operational problem that requires managing candidates and staff, often either collecting information (such as running polls) or disseminating information (making speeches), and always in a budget-constrained environment.
Metrics
Some of the most important metrics include:
- Whether the candidate wins the election or not.
- The number of votes from the electoral college.
- Polls in each state (especially the swing states).
- The amount of money on hand each week.
- Donations each week.
- Donations in response to social media posts.
- Weekly expenditures.
Decisions
The campaign manager has to make a number of decisions, including:
- Where to give speeches each day.
- What themes to emphasize.
- Choice of vice-presidential candidate.
- What advertising channels to use (television, social media, billboards), and spend rates.
- Expenditures on printed promotional material (signs, mailings, pamphlets).
- How many people to hire at different levels, by region.
- Where to set up field offices.
- When and where to run polls, what questions to ask.
Uncertainties
Presidential elections have to be managed in the presence of a number of uncertainties:
- How many votes the candidate receives.
- Change in favorability ratings over time, and after major events (e.g. national convention).
- Change in favorability ratings after highlighting different themes.
- Donations overall, and in response to specific calls for donations (e.g. through text messages).
- Anticipated biases in the polls.
- Events in the news that impact public perception (favorably or unfavorably) of the candidate’s policies.
- Attack ads by opponents.
- Large donations to favorable or competitive super-PACs.
- Adverse health events impacting the candidate.
Truckload fleet management
Narrative
In the U.S., freight primarily moves in the form known as full truckload trucking, where a shipper fills what is typically a 53-foot trailer that will pull up to 46,000 pounds (depending on the type of freight) from one location to another. They operate similarly to taxis – the truck driver (with a tractor) will move empty to pick up a load of freight at one location and then drive it to another where the trailer is either unloaded or dropped off to be unloaded later. A driver might move one or two loads in a single day, but most loads take anywhere from 1 to 5 days.
Once a driver drops a load, the challenge is to minimize the number of miles the driver has to move empty to pick up another load. Three issues really complicate running a truckload carrier:
- The movement of freight is not balanced. There are regions of the country that produce more freight than is consumed (this is particularly true of the Midwestern U.S.) and regions that are primarily consuming regions (typically the coasts and major cities). As a result, the market is willing to pay much more to move freight from producing regions to consuming regions, while loads out of consuming regions may not even pay enough to run the truck (but it is better than moving empty).
- Truck drivers need to observe strict rules on how many hours they can drive each day and each week. In addition, they need to return home, either daily, or weekly, or, for long-haul drivers, once or twice a month.
- The booking of freight is highly dynamic. Most loads are booked one to three days into the future. A trucking company may have to hold drivers to meet the needs of a top shipper who only calls in loads a day in advance.
There are over 2 million drivers working in the truckload industry. Most trucking companies operate with fewer than five drivers, while others have 10,000 drivers or more.
Metrics
The most commonly reported performance metrics include:
- Operating profit per week or per mile.
- Revenue per driver per week or per mile.
- Empty miles as a percent of total miles.
- Miles per driver per week.
- Fraction of time that drivers get home on time.
- Percent of time loads are picked up and delivered on time.
- Driver turnover (number of drivers quitting per week).
Decisions
Decisions from the perspective of the manager in charge of dispatch and load planning might include:
- Which load a driver should be assigned to.
- Whether to accept a load that is offered to be picked up in the future.
- Whether a load should be handled by the carrier’s own drivers or a brokerage division (which finds owner-operators who can move the load).
- What price should the trucking company offer to move freight for a shipper in a particular traffic lane (origin-destination pair) in the upcoming year? This is part of an annual “bidding process” that determines the preferred carrier for each shipper for each lane.
- How many drivers to hire who live in a particular location (called a driver domicile).
- How many tractors and trailers should the fleet be operating.
Uncertainties
Some of the uncertainties faced in truckload trucking include:
- How many loads will be offered each day, in each lane, by the primary shippers that the carrier is serving?
- How many loads will be available to be moved, and at what price, on public “load boards” that any carrier can choose from?
- Will a driver accept an assignment to a particular load?
- Are freight volumes trending up or down?
- What are current spot prices?
- Will a load on an external load board actually be available if the carrier elects to move it?
Mutual fund cash management
Narrative
A mutual fund manager who had taken an operations planning course for his MBA was introduced to a classic problem known as the “newsvendor problem.” Newsvendor problems arise when you have to decide on a quantity of a resource (for example, newspapers) to allocate to serve a demand that is not known when you make your decision. If you allocate too much, you will have resources left over, where we assume they cannot be held for the future (just as today’s newspapers are of no value tomorrow). If we allocate too few, then we will have unsatisfied demand.
After finishing his MBA (at a top business school), the mutual fund manager faced the problem of deciding how much cash to keep on hand to handle requests for redemptions. The problem is summarized in the email shown in figure 2.7, but the core elements are as follows:
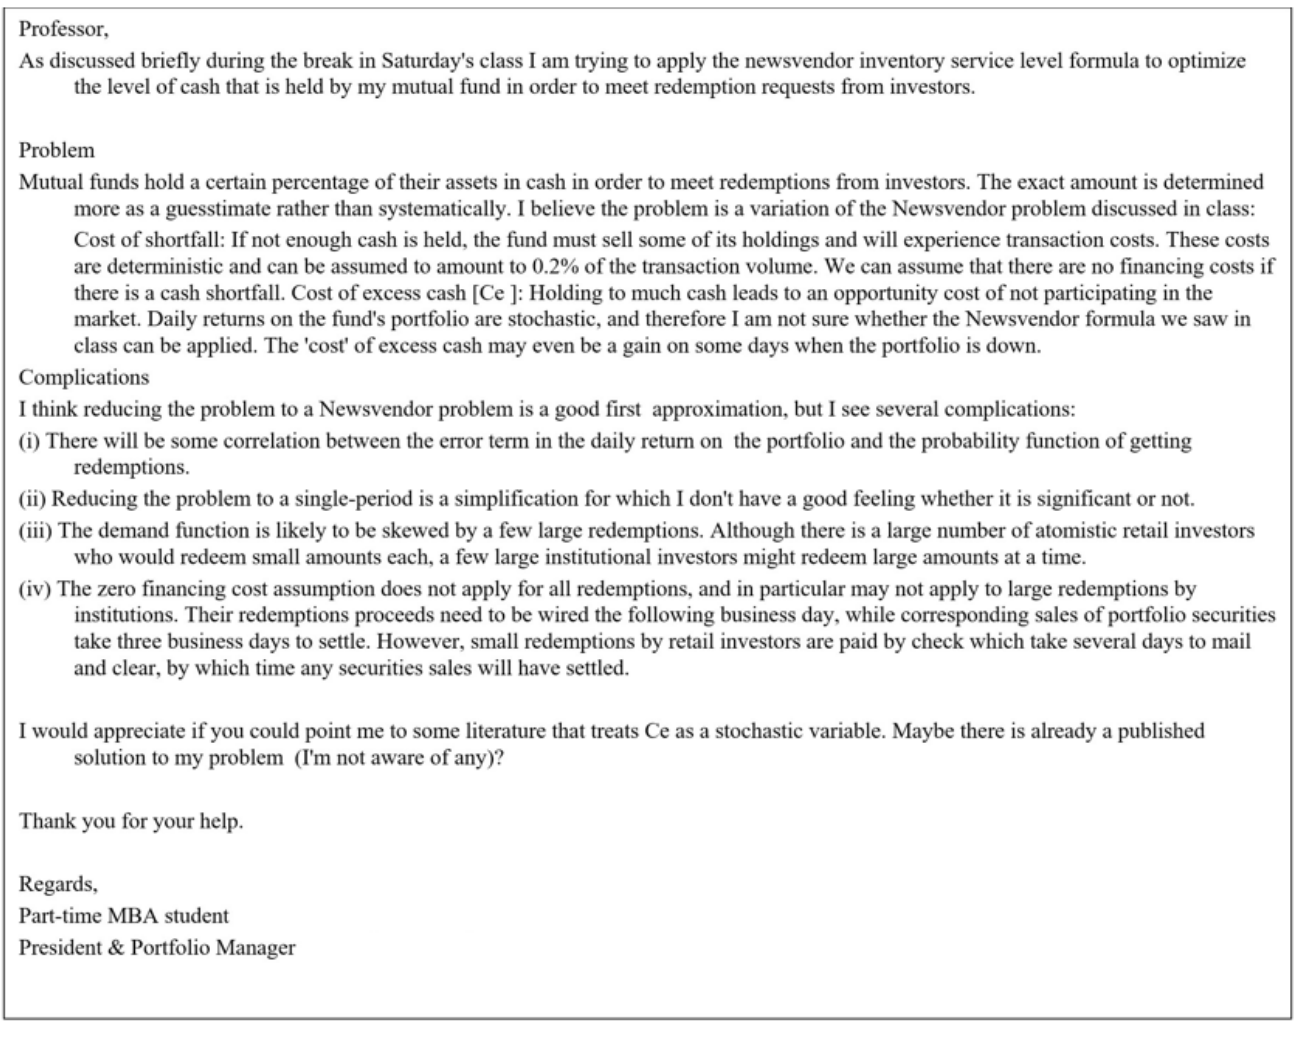
- The mutual fund has to maintain enough cash to meet requests for redemptions. If there is not enough cash on hand when a redemption request comes in, they will have to liquidate stocks, incurring transaction costs, and possibly being forced to sell at a lower price. If they hold too much cash, then they are missing out on the potential growth of investments in the market.
- There are two types of customers: retail and institutional investors. Redemptions for retail investors may take several days to clear, while the larger redemption requests from institutional investors have to be settled the same day.
- Deposits and redemption requests are correlated with market performance. Growth in the market can attract new deposits, while drops can trigger sudden requests for redemptions.
Metrics
The metrics involved in this exercise include:
- Overall return on the portfolio each day, net of operating costs (transactions costs, redemption expenses).
- Amount of cash being held.
- Sales required to cover redemption requests.
Decisions
The decisions faced by the mutual fund manager are:
- How much cash to hold.
- Which assets to sell to raise cash.
- Which assets to purchase when there is too much cash on hand.
Uncertainties
The decisions have to be made in the face of the following uncertainties:
- Deposits by retail or institutional investors.
- Redemption requests by retail or institutional investors.
- Changes in market indices.
- Changes in interest rates.
Supply chain finance
Narrative
Every supply chain transaction involving the purchase or sale of commodities, components and final products implies a flow of money, creating a complex network of flows between buyers and sellers (at all levels of the supply chain), along with third-party financial partners who may supply financing and insurance.
The steps in a financial transaction typically include:
- Supplier sends goods and invoices to the buyer.
- Buyer approves the invoice in their ERP system.
- Once approved, the supplier may choose to be paid early by the financier (which might be a bank).
- Financier pays the supplier (typically at a discount).
- Buyer pays the financier at invoice maturity (perhaps 60 or 90 days later).
There are a variety of financial transactions that may occur, such as:
- Invoice approval – Buyer confirms invoice is valid and due for payment.
- Receivable assignment – Supplier assigns the invoice to the financier.
- Early payment – Financier pays supplier before due date.
- Maturity payment – Buyer pays financier on agreed due date.
- Transaction fees/discounts – Financier earns a fee from the transaction.
There are a number of sources of uncertainty in supply chain management that have an impact on finances. Companies can protect themselves using different forms of insurance. Some examples are:
- Inventory insurance - Protects goods held in warehouses or in-transit (including 3rd-party logistics centers) against theft, damage, or loss.
- Currency hedges to protect against changes in the relative value of different currencies when importing from other countries.
- Trade credit insurance - Protects suppliers or lenders against the risk of buyer non-payment due to insolvency, protracted default, or political events.
- Marine cargo insurance - Covers physical loss or damage to goods in transit—via land, sea, or air—during international or domestic shipment.
- Political risk insurance - Protects against losses due to political instability, such as expropriation, currency inconvertibility, import/export restrictions, war or civil unrest.
- Performance bond insurance - Guarantees that a supplier or contractor will meet contractual obligations. Insures buyers against supplier failure.
- Credit default swaps - Used by financial institutions to hedge against counterparty credit risk.
Metrics
There is quite a long list of financial metrics used by larger companies. A sample of those that are directly related to the financial management of a supply chain include:
- EBITDA – Earnings before interest, taxes, depreciation and amortization. This is a high-level metric that captures cost of goods sold (COGS), revenues, and all costs incurred to manage the flow of cash and capital.
- Return on equity (ROE) and earnings per share (EPS).
- Free cash flow.
- Working capital and cash reserves.
- Debt to equity ratio.
- Interest expense.
Decisions
A sample of decisions made by a chief financial officer include:
- Choice of financing strategies for different transactions.
- Choice of forms of insurance (see list above).
- How much cash to maintain, and in which accounts.
- Dividend payments.
- Capital allocation.
- Debt vs. equity financing.
Uncertainties
Again, a small sample of different forms of uncertainty arising in supply chain finance include:
- Payment defaults by buyers and sellers.
- Currency variations.
- Changes in tariffs and trade restrictions.
- Recession risk, shifts in overall sales (up or down).
- Interest rate volatility.
- Credit market volatility.
Intelligent trial and error
Narrative
There is a massive problem class in decision-making that can be best described as “intelligent trial and error.” These arise when there is a set of discrete choices, and where the performance of each choice is uncertain. Examples of problem settings where this arises include:
- Materials science
- What chemicals to blend to make a new material.
- What temperature to run a process.
- What steps in the manufacturing process.
- Health
- What drug to try to treat a condition.
- Whether to run a test (imaging, blood test).
- Where to locate a clinic for distributing naloxone kits.
- E-commerce
- Which of two web page designs to use.
- Which product to advertise on a webpage to maximize revenue.
- What price to charge for a product (out of a set of possible prices).
- Manufacturing
- Optimizing a semiconductor manufacturing process (temperatures, time in a chemical bath, chemical concentrations, diameter of the silicon wafer).
- Finance
- Finding the best settings for the parameters of a trading policy.
- Which supplier to use, given the risk of default.
- How much reserve capital to maintain.
- Supply chain management
- Which supplier to use for a product given uncertainty about product quality.
- Setting the reorder points for stock replenishment.
- What advertising channels to use.
- Choice of people
- Baseball – Who should bat fourth, or play catcher.
- Basketball – Who should play each position.
- Portfolio managers – Who gets the best results managing a portfolio.
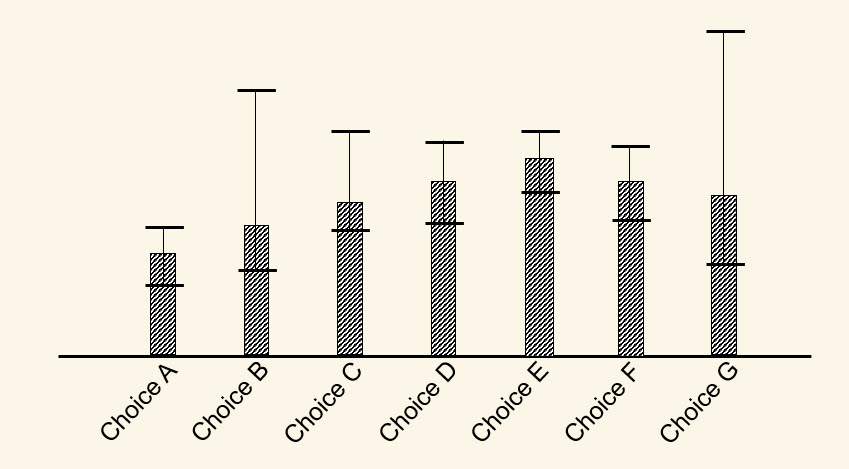
Each of these contexts involves choosing from among a set of choices. We want to choose the one that works the best, but we are not sure how well each will perform. The situation is depicted in figure 2.8. There may be two choices, dozens, hundreds, and many thousands.
This basic problem comes in a variety of flavors:
- Belief model
- Independent beliefs – This is where our belief about one choice is unrelated to the beliefs about other choices. In real applications, this is relatively rare.
- Correlated beliefs – Choices may share features, such as drugs from the same family, a style of shirt with different colors, or the “closeness” of two choices, especially if they represent a discretized price, or concentration, or geographical location.
- Parametric models – We may construct our beliefs using a parametric model, such as a linear model relating different prices to estimated demands.
- Cost of running a test
- Inexpensive experiments – Observing how many times an ad is clicked on a webpage is a very inexpensive way to conduct an experiment. Time frames may span microseconds to seconds to minutes.
- Expensive experiments – A laboratory experiment may take a day to a week (or more). Complex computer simulations may take hours to a week or more.
- Noise level
- Low noise experiments produce accurate estimates from a single trial.
- High noise experiments produce very noisy outcomes, requiring multiple tests with the same or similar choices.
- Offline vs. online learning
- Offline learning describes experiments done in a lab or computer simulation, where we can tolerate poor performance from an experiment.
- Online learning describes learning done in the field, where we have to live with the outcome of an experiment (such as testing a price of a product, or how a drug works on a patient).
- Presence of physical or financial resources – Basic learning problems are linked from one experiment to another purely on the basis of what we learn. However, it is possible that problems are linked by a physical (or financial) resource:
- There may be a fixed budget for running experiments. Each experiment consumes some portion of the budget.
- Physical experiments may require inventories of ingredients that have to be available.
- An experiment may require a machine that is set up to perform a specific task, which means it is easier to do other experiments that need the same setup.
- Sequential or parallel experiments
- Sequential experiments:
- A patient can be used to test one drug at a time to determine which works best on that patient.
- A manufacturer may be able to test one process at a time to determine which produces the highest yield.
- Parallel experiments:
- A retailer can run multiple promotional campaigns (e.g. in-store advertising) at different stores to learn which works best.
- A scientist can test dozens or hundreds of different compounds on a single plate to see how they react to a particular type of cancer cell.
- Sequential experiments:
- Instantaneous vs. lagged learning
- Instantaneous learning - We make a choice (e.g. to run an experiment) and learn the results immediately.
- Lagged learning - There is a time lag between when we run an experiment vs. learn the outcome. Lags can be minutes in high-speed settings, up to a year or more, as would occur when a bank offers a loan, and has to wait years to learn if the loan recipient misses payments or defaults.
Any of these settings can still be described by our trio of metrics, decisions and uncertainties.
Metrics
Any “experiment” is assumed to return an observation of performance, whether it is the number of ad-clicks, or the response of a patient to a drug, or the yield of a process for manufacturing semiconductors. Of course, there may be more than one metric to describe performance, which we may wish to optimize in some combination. However, we should distinguish two important dimensions of performance:
- The cost of trying each choice.
- Average performance over some horizon.
- The variability around the average, which captures the reliability of a process.
- The likelihood of “poor” outcomes.
- Other performance metrics, such as side effects of a drug, or the potential of significant losses in market share.
Decisions
This is simple – it is the set of choices. These might be:
- Binary – Such as
- Whether to take an action (sell a company, launch a new product, send a drug to clinical trials) or not.
- Whether to hold or sell an asset.
- Which of two webpage designs to use (often called A/B testing).
- Whether to give a patient a drug, or not.
- Discrete set – This could be a set of suppliers, a choice of different drug treatments, different marketing channels to advertise a product, or any of a set of thousands of molecular compounds to be tested in drug development.
- A discretized set of values of a continuous parameter, such as the price of a product, the concentration of a chemical, the temperature for baking a semiconductor.
There are problems where the set of choices is not obvious. For example, we may be looking for a supplier who can make a specialized component out of a new material which requires working at high temperatures. Or we need a very special chemical to make a new vaccine, or an extremely pure form of a gas that is needed in the process of making the latest semiconductor chips. Finding suppliers, or materials, or chemicals, to fit a need can be extremely challenging.
Then there are going to be problems where we know our performance metric, but do not know how to improve it. A cement manufacturer may need to cut costs to be competitive, but does not have a clear strategy for how to achieve this. A physician wants to treat a condition in a patient but does not know what treatment to pursue.
Uncertainties
Uncertainties for discrete choice (trial-and-error) problems can come in two forms:
- The performance of a choice, which typically differs from how we thought it would perform when we decided to use the choice. We may have a point estimate of the metric(s) for each choice, or some form of distribution. The actual performance is typically different than the point estimate, and if we are given a distribution of possible outcomes, the actual outcome may not necessarily be drawn from an assumed distribution.
- Whether the choice is available – Some examples are:
- The choice may be a supplier, who is unable to bid on a contract.
- The choice may be a person to fill a job, but they may not be willing to take the job.
- We may want to use a type of material, but supply chain issues may restrict its availability.
Exercises
When an exercise asks for an interaction matrix, you can use the template for the “Framing Interaction Matrix” that can be downloaded from tinyurl.com/InteractionMatrix/.
- For the inventory problem, pick a product you are familiar with (for example food, clothing, household items, drugs, or hardware) and answer the following:
- Identify metrics, decisions and uncertainties that seem relevant to your problem, using the lists of each dimension from the inventory section as a guide.
- Use the Framing Interaction Matrix to create interaction matrices to capture your best estimate of the impact of each type of decision on each performance metric.
- Repeat (b) to capture your best estimate of the impact of each type of uncertainty on each performance metric.
- For the demand management problem:
- Choose a set of metrics, decisions and uncertainties that you think would be faced by a store manager at a retail furniture outlet.
- Use the Framing Interaction Matrix to create interaction matrices to capture your best estimate of the impact of each type of decision on each performance metric.
- Repeat (b) to capture your best estimate of the impact of each type of uncertainty on each performance metric.
- For the power grid problem:
- Choose a set of metrics, decisions and uncertainties that you think would be faced when performing daily planning of power generators.
- Use the Framing Interaction Matrix to create interaction matrices to capture your best estimate of the impact of each type of decision on each performance metric.
- Repeat (b) to capture your best estimate of the impact of each type of uncertainty on each performance metric.
- For the hotel revenue management problem:
- Choose a set of metrics, decisions and uncertainties that you think would be faced when managing bookings for rooms over a two-month planning horizon.
- Use the Framing Interaction Matrix to create interaction matrices to capture your best estimate of the impact of each type of decision on each performance metric.
- Repeat (b) to capture your best estimate of the impact of each type of uncertainty on each performance metric.
- For the problem of managing type 2 diabetes:
- Choose a set of metrics, decisions and uncertainties that you think would be faced by a physician making decisions about a patient with type 2 diabetes.
- Use the Framing Interaction Matrix to create interaction matrices to capture your best estimate of the impact of each type of decision on each performance metric.
- Repeat (b) to capture your best estimate of the impact of each type of uncertainty on each performance metric.
- For the naloxone kit management problem:
- Choose a set of metrics, decisions and uncertainties that you think would be faced by a state government planning the allocation of naloxone kits to different counties using funding from the federal government.
- Use the Framing Interaction Matrix to create interaction matrices to capture your best estimate of the impact of each type of decision on each performance metric.
- Repeat (b) to capture your best estimate of the impact of each type of uncertainty on each performance metric.
- For the problem of running a presidential election:
- Choose a set of metrics, decisions and uncertainties that you think would be faced by the campaign manager for a candidate running for president.
- Use the Framing Interaction Matrix to create interaction matrices to capture your best estimate of the impact of each type of decision on each performance metric.
- Repeat (b) to capture your best estimate of the impact of each type of uncertainty on each performance metric.
- For the problem of managing a truckload fleet:
- Choose a set of metrics, decisions and uncertainties that you think would be faced when planning the problem of accepting which loads to move (typically performed up to seven days in the future).
- Use the Framing Interaction Matrix to create interaction matrices to capture your best estimate of the impact of each type of decision on each performance metric.
- Repeat (b) to capture your best estimate of the impact of each type of uncertainty on each performance metric.
- Consider the mutual fund cash balance problem:
- The email from the mutual fund manager suggests a way of deciding how much money to hold in cash. Write out that formula.
- Use the Framing Interaction Matrix to create interaction matrices to capture your best estimate of the impact of each type of decision on each performance metric.
- Repeat (b) to capture your best estimate of the impact of each type of uncertainty on each performance metric.
- Name an example of a "trial-and-error" problem that you encounter in your own experience, where you have to make the same choice repeatedly.
- Describe the context of the trial-and-error problem, and what triggers the need to make the decision again.
- Describe the metrics (one or more if necessary), the set of choices, and all forms of uncertainty that arise in the process of making decisions.
- Suggest how you would go about making a choice.